
From crawl to classification: the first step in mapping your content
The goal of multilingual content classification is to understand how your existing pages relate to each other, figure out where topics overlap, and highlight where content might be irrelevant or underperforming. For content leads and marketing teams, you must get a clear picture of which articles can be optimised, which should be consolidated, and where new opportunities lie.
To get to that level of insight, you need to rely on structured data rather than assumptions. Screaming Frog SEO Spider is the ideal starting point, and goes beyond a technical audit and lets you measure how semantically similar different pieces of content are. Screaming Frog can show you where clusters of related topics exist and where outliers sit on their own, by combining a site crawl with AI-driven analysis.
You’ll start with a full crawl of your website. Once the crawl is complete, you enable additional checks in Crawl Analysis → Configure → Content, where you can turn check for semantic similarity, near duplicates, thin content, and low relevance. For the semantic similarity to work, Screaming Frog connects with an AI API like OpenAI or Hugging Face, which allows it to compare page content by meaning rather than by matching words.
The Content tab will populate with new filters when you rerun the crawl analysis. You can also generate detailed reports through Bulk Export → Content.
These are the most important outputs for classification:
- Semantically Similar Pages: lists pairs of URLs that are closest in meaning and form the basis for content clusters.
- Exact Duplicates: confirms which pages are identical and therefore redundant.
- Near Duplicates: detects pages that overlap heavily without being identical.
- Thin Content: identifies pages with too little information to stand alone.
- Low Relevance Content: highlights pages that are semantically distant from your site’s overall focus.
These exports give you a map of how the site’s content is structured in practice. With multilingual websites, this is particularly valuable because, you can detect when content is being repeated unnecessarily across markets, when regional content diverges too far from the main strategy, and when functional pages, like login or policy screens, are being grouped with topical material.
The foundation of the analysis that follows is that it tells you where clusters exist, as well as where the gaps are, so you can decide whether the content needs to be consolidated, rewritten, or completely removed.Making sense of the dots: what clusters and outliers really mean
Cluster visualisation diagram
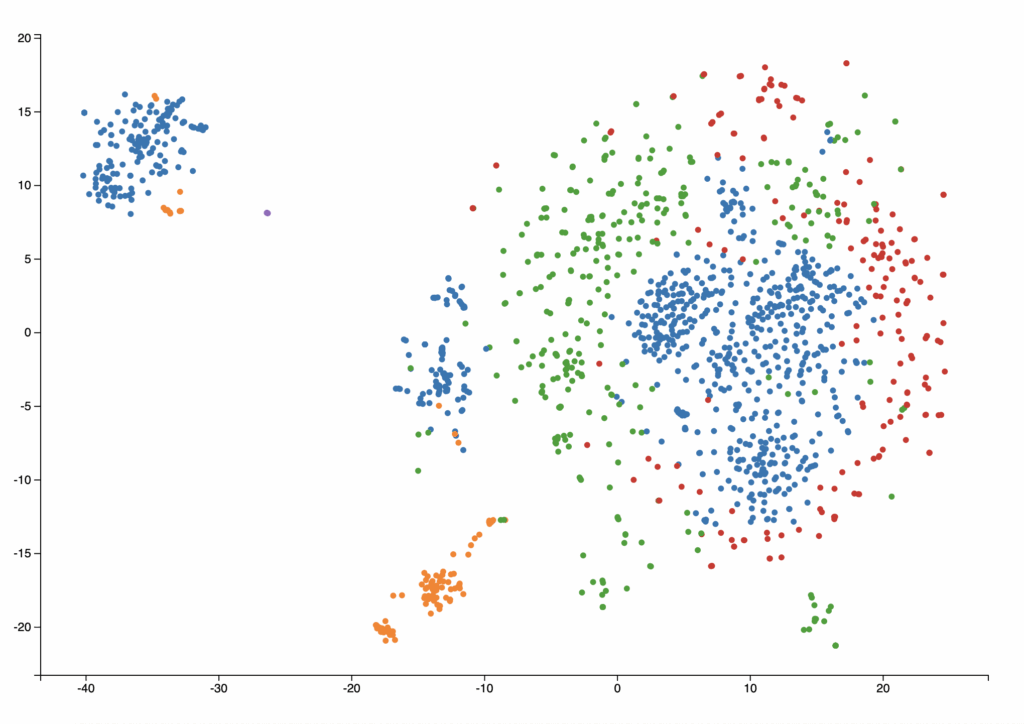
The chart below represents our content landscape after running the semantic analysis. Each dot is a page on the site, and its position is determined by how closely its content relates to other pages.
- Colours: Each colour represents a different cluster. These are groups of pages that cover similar themes, like, one cluster might be centred on thought leadership articles, another on service descriptions, and another on regional market insights.
- Clusters: When dots of the same colour appear close together, it shows that they align thematically, showing where content is concentrated, and where your site shows topical authority.
- Outliers within clusters: Some dots share a cluster colour but sit on the edges of the group. These are weaker or less aligned pieces of content that belong to the cluster, but are not as strong a match as others. They are often the first candidates for optimisation or rewriting.
- Isolated content: Dots that sit far away from any cluster are usually unrelated to the main themes. These might be legacy articles, policy pages, or niche case studies. Their distance on the graph suggests that they are semantically disconnected, and they should be reviewed to decide if they need repurposing or removal.
Reading the chart like this allows you to move beyond a list of pages and see your site as a set of connected topics. It makes it clear where the strong coverage is, where overlaps are happening, and where valuable resources are being wasted on irrelevant or disconnected content.
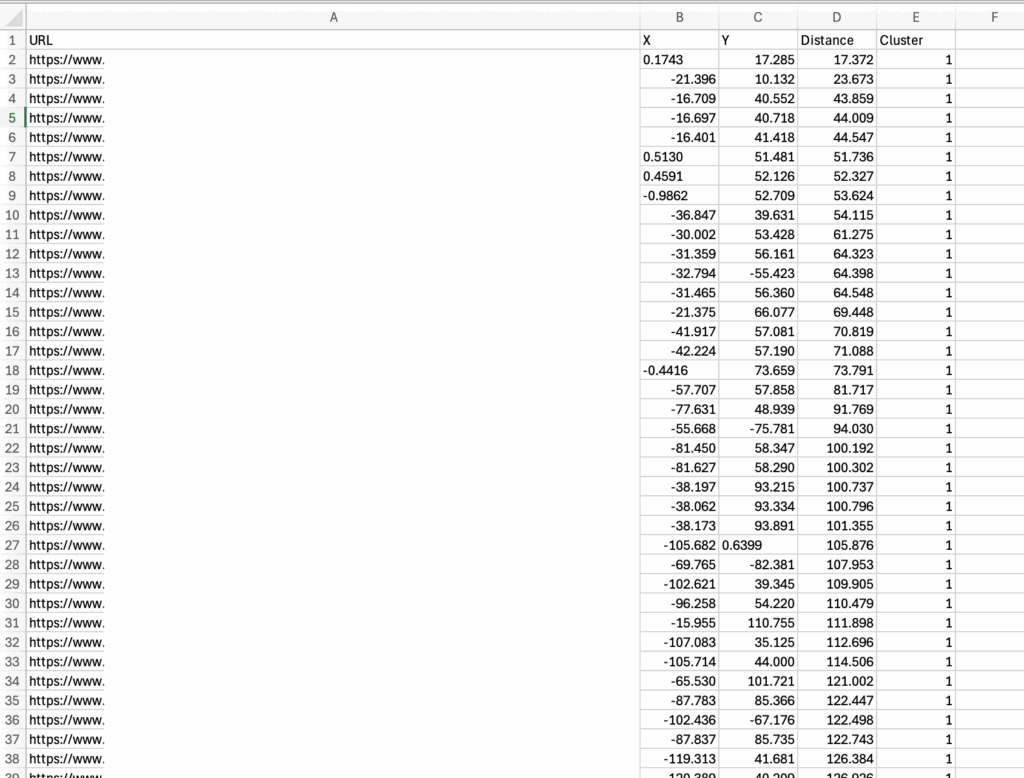
Alongside the visual chart, it’s useful to have a structured view of how pages group together. By exporting the semantically similar URLs into a table and organising them into clusters, you can move from a network diagram to a list of content families, so it’s easier to see what each cluster is about and which pages belong to it.
When you look at the table, a few patterns usually emerge:
- Cohesive topic clusters
Many clusters form around clear themes, like articles that cover industry news, pages that describe services, or resources that explain a specific area of expertise. These clusters confirm where your content strategy is concentrated and can show areas of strength.
- Mixed clusters with functional pages
Some clusters include a mix of blog posts, customer stories, and even functional pages, like login or policy screens. These pages are groupedbecause of overlapping language, not because they serve the same purpose. This is a red flag that the content may not be clearly differentiated, and it suggests a need to refine metadata, rewrite sections, or separate the navigation from the editorial content.
- Outliers within clusters
In almost every group, there are pages that technically fall into the cluster but sit further away from the rest. These tend to be weaker or less aligned pieces, like an old blog post mixed into a corporate news cluster, or a regional article within a global theme. These outliers are the first candidates for optimisation, and they can be rewritten to better match the topic or consolidated into a stronger page.
- Content far from any main cluster
Finally, some content appears completely isolated, between clusters, or disconnected altogether. These are usually legacy articles, niche case studies, or once-off announcements. They rarely drive traffic or rankings, but still consume budget. For these, the best option may be to repurpose the content into a relevant cluster or retire it if it no longer adds value.
The classification table, then, is a way to see the “shape” of your content strategy. It shows where you have authority, where you risk duplication, and where your resources are being spread too thin.
Turning semantic insights into smarter content decisions
Running the exports and reading the visualisation gives you the map you need, but the real value comes when you use this information to improve the content. At Key Content, we treat each type of finding as an opportunity to optimise, consolidate, or expand in ways that are always supported by performance data.

Semantically similar pages
What it shows: Pairs of URLs that are close in meaning and form the basis of content clusters.
What to do: Review these pairs to see if they are complementing each other or competing. If two articles are covering the same ground, consolidate them into a stronger single piece. If they are related but distinct, make sure they are clearly differentiated and internally linked.
How we measure: Look at impressions and clicks per page in Google Search Console and GA4 to see which page is performing better. The goal is to keep the stronger performer and use it as the anchor in the cluster.
Exact duplicates
What it shows: Pages that are identical in content, often caused by technical issues or unnecessary replication across languages.
What to do: Decide whether to remove duplicates or consolidate them with canonical tags. In multilingual sites, check that translations are implemented correctly and not showing the same English copy to multiple regions.
How we measure: Check if duplicates are splitting impressions or traffic. If both versions are underperforming, merge them into one authoritative page.
Near duplicates
What it shows: Pages that are not identical but overlap heavily, like two market pages describing the same product with slightly different wording.
What to do: Merge when possible, or clearly differentiate them by tailoring the content to regional or user intent differences. Near duplicates are also prime candidates for transcreation or content creation, so the message can be adapted so that each market has content that feels original.
How we measure: Compare traffic and conversion per page. If both are weak, consolidate the pages. If one market version is strong, refine the other to match its positioning.
Thin content
What it shows: Pages with too little content to stand alone.
What to do: Expand or combine them. Thin pages dilute topical authority and make clusters weaker. These are often product or service pages with minimal copy, or legacy blog posts that don’t cover a topic in depth.
How we measure: Check bounce rates, time on pages, and conversions in GA4. Thin content rarely drives engagement, so refreshing or merging is the best option.
Low relevance content
What it shows: Pages that are semantically distant from the site’s main focus. They may appear far away in the visualisation and not fit into any cluster.
What to do: Evaluate whether they still have a role. If they serve no SEO or user purpose, they should be retired. If they are valuable but misaligned, consider repurposing or rewriting them to better connect with your core themes.
How we measure: Cross-check with traffic and conversions. Many of these pages have negligible performance. If they rank for irrelevant queries, they are distracting from the main strategy.
From issues to opportunities
The key is treat these findings as guidance for strengthening clusters, rather than failings or errors. Once we have the list of semantic issues, we add a performance layer:
- Traffic per page and per cluster: identify where clusters are delivering value and where they are weak.
- Impressions vs clicks: if a cluster is visible but not getting clicks, it may need stronger optimisation.
- Cluster opportunities: check whether there are themes that appear weak or fragmented, and use those signals for a new content strategy or expansion into fresh topics.
- Content adaptation: multilingual analysis often shows that one market has a stronger cluster than another. This highlights where local teams need new content or improved localisation.
By combining semantic analysis with performance data, we can decide if a cluster should be consolidated, if weak pages should be rewritten, or if entire clusters should be retired. The outcome is a stronger, more coherent content ecosystem that avoids duplication and invests in areas with the highest potential.
Putting semantic analysis into practice
Identifying clusters and issues is only the first step. The real impact comes when you apply the findings to improve content quality and strengthen topical authority. Here are some practical scenarios that often emerge from multilingual analysis:
Optimisation: strengthening outliers
In one cluster of articles about international marketing trends, we found a page sitting on the edge of the group. It had lower engagement and was missing the right terminology used in the stronger pages. Instead of removing it, we updated the copy, added examples relevant to different regions, and aligned the metadata. As a result, the page moved closer to the core of the cluster and started driving higher impressions.
Consolidation: merging overlapping content
Two separate guides covered very similar themes about adapting websites for global audiences. Both attracted traffic, but each page was splitting visibility for the same queries. By merging them into a single, comprehensive guide and redirecting the weaker URL, we created one stronger asset. The consolidated page gained higher rankings, and the cluster overall performed better because it now had a clear anchor piece.
Deletion: retiring low-value pages
During the analysis, we also found older case studies and outdated product pages that didn’t fit into any cluster. They were isolated in the visualisation, had little or no traffic, and no strategic value. These pages were retired to freeup crawl budget and make sure the site’s content footprint reflected the current strategy.
Expansion: identifying gaps
The classification also revealed gaps where clusters were smaller than expected, like one market having only a handful of pages around a key service, while another language had a rich, high-performing cluster. This signalled a clear opportunity to create new localised content to replicate the strong cluster across markets, and give the site consistency in authority and user experience.

Strengthening clusters via internal linking and journey optimisation
Why internal linking matters for clusters
Internal linking does more than guide users from one page to another. It’s the connective tissue that gives structure and authority to your content clusters. A strategically created internal link architecture shows search engines which pages are important, reinforces topic relevance, and improves crawlability.
Poorly linked pages are less likely to rank well, especially when they’re buried deep in the site architecture. Internal linking helps build topical hierarchies and improves site navigation for users and bots. For content leads and marketing departments, this means internal linking is a powerful lever to amplify cluster authority, especially when semantic analysis has revealed the structure of your content ecosystem.
How to uncover internal linking opportunities with Screaming Frog
Here’s how you use Screaming Frog’s features to align internal linking with your semantic clusters:
- Identify poorly linked pages
- Export Bulk Export → Links → All Inlinks to see how many internal links each page receives.
- In the Internal tab, sort by Unique Inlinks or Link Score to prioritise pages that need support.
- Leverage performance data to prioritise
- Integrate GA4 and Google Search Console APIs in Screaming Frog via Configuration → API Access.
- Focus on pages that drive impressions but low clicks, or important cluster pages with few internal links, because these are high-impact opportunities.
- Source anchor text contextually
- Use Custom Search to find unlinked keywords across your site that are natural anchor opportunities.
- Or use N-grams to identify recurring terms in body text that aren’t yet linked. This is ideal for adding contextual internal links.
- Audit anchor text and cannibalisation
- Review non-descriptive or overused anchor text that may dilute context or confuse intent.
- Effective anchors use natural language, semantic variations, not just an exact-match, and balance relevance with user clarity.
Aligning internal links to semantic clusters: our expert process
Once we’ve identified the clusters via semantic analysis, here’s our workflow for strengthening them:
| Task | Objective | |
| Map clusters to pages | Identify high-performing pages in the cluster and weaker cluster members | |
| Export All Inlinks and performance data | Use GA4/GSC to find under-linked pages with potential | |
| Prioritise link injection | Link from strong cluster anchors to weaker or newer pages | |
| Anchor text optimisation | Use descriptive, relevant keywords to reinforce thematic relationships | |
| Monitor impact | Use crawl comparison to see ranking improvements over time |
Example scenario:
In a translation-focused cluster, an anchor pillar article had high traffic and several internal links. A related, but underlinked, regional variation sits at the periphery. By inserting a contextual link from the pillar page using a descriptive anchor, authority transfers to the weaker page and improves the crawl depth and potentially boosts visibility.
The user journey benefits
Well-structured internal links:
- Help users navigate from broad pillar content to specific supporting resources seamlessly.
- Improve engagement by guiding users deeper into relevant clusters.
- Reduce click depth. Pages with fewer clicks from the homepage tend to rank better.
The result? Clusters are SEO robust, as well as user-journey friendly, which reinforces relevance, authority, and discoverability.
Wrapping up: building stronger clusters through content
Semantic analysis gives you a new way to look at multilingual websites. Instead of only tracking keywords or technical errors, we can see how content hangs together, like where it overlaps, where it spreads too thin, and where it fails to connect.
By combining Screaming Frog exports, visualisations, and performance data, we can:
- Detect clusters of related content and identify their anchor pieces.
- Find overlaps and duplicates that should be consolidated into stronger pages.
- Spot outliers that can be optimised, rewritten, or expanded to align with their cluster.
- Retire irrelevant content that distracts from core themes.
- Strengthen internal links to connect clusters, improve crawlability, and guide users more effectively.
The key is to treat every finding as an opportunity. Thin or low-relevance content gives you a chance to repurpose or expand. Duplicate and near-duplicate content show where you can consolidate and avoid cannibalisation. And well-structured clusters, once reinforced with internal links, become the foundation of topical authority across markets.
For content leads and marketing departments, this approach provides clarity and efficiency. Instead of creating content in isolation, you are working within a clear structure, ensuring every piece plays a role in strengthening your clusters and driving discoverability.
The outcome is stronger SEO performance and a better user journey, withcontent that’s relevant, connected, and comprehensive, whether in English, Spanish, or any other language.
Checklist: strengthening your content clusters
- Crawl and export
- Run a full site crawl in Screaming Frog.
- Enable content analysis like semantic similarity, duplicates, thin content, low relevance.
- Export: Semantically Similar Pages, Exact Duplicates, Near Duplicates, Thin Content, Low Relevance Content, All Inlinks.
- Visualise and classify
- Review the Content Cluster Diagram to identify clusters, outliers, and isolated content.
- Use the semantically similar export to group URLs into clusters.
- Create a classification table to map each cluster and its members.
- Analyse content strength
- Check performance metrics, including traffic, impressions, clicks, and conversions per page and per cluster.
- Identify strong cluster anchors versus weak or underperforming pages.
- Spot missing clusters or underrepresented topics.
- Act on findings
- Optimise outliers by rewriting or expanding them.
- Consolidate overlapping or near-duplicate content into stronger, single assets.
- Delete or repurpose low-relevance or outdated pages.
- Expand thin or missing clusters with fresh, market-specific content.
- Strengthen connections
- Use internal linking to connect cluster anchors with weaker or newer pages.
- Optimise anchor text to be descriptive and user-focused.
- Ensure every important page has strong inlinks and is easy to navigate.
- Monitor and adapt
- Re-run crawls periodically to track improvements.
- Compare performance over time using GA4 and GSC data.